4. How to optimize exposure with the histogram
What is optimal exposure?
In digital photography, optimal exposure is the light signals of the scene being shot, recorded by the camera’s sensor into the image file as fully as possible, up to the maximum level the sensor is able to capture.
The limits of the sensor
These light signals are represented by a series of tonal steps, from the brightest to the darkest in the scene, measured in stops of light, or f/stops, or more commonly stops, a unit of measurement for a range of quantities of light. For example, the range of light from the darkest to the brightest step in a sunrise or sunset scene is about 15–17 stops. After the sun has cleared the horizon, glaring bright and not covered by clouds, it is about 18–19 stops.
But the recording capability of today’s camera sensors (as of 2026) is at most only about 14 to 15 stops measured in practice (Sony α7R VI and Sony α7 V: up to 16 stops as Sony states), not wide enough to record the whole range of light in the scene.
Imagine a 19 m (62 ft) long photo that you want to fit into a 14 m (46 ft) frame: what will happen? If you give priority to the bottom part, the top of the photo will be cut off, and if you give priority to the top part, the bottom will be cut off.
Similarly, when you want to shoot a 17-stop sunrise with a 14-stop camera (Sony α7 V: up to 16 stops as Sony states, still short of a 17-stop scene), you have to give up part of the scene’s range of light. If you give up the darkest part (prioritizing the bright), the foreground will be clipped to black. If you give up the bright part (prioritizing the dark), the clouds will be blown out. The clipped detail is like broken rungs of a ladder, with no more smooth transition from one tonal step to the next.

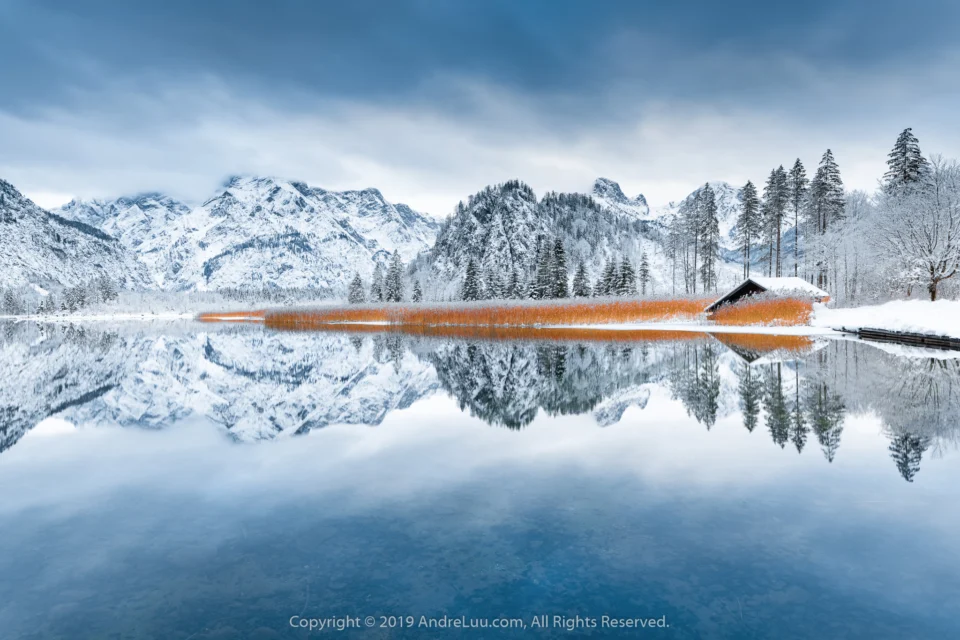
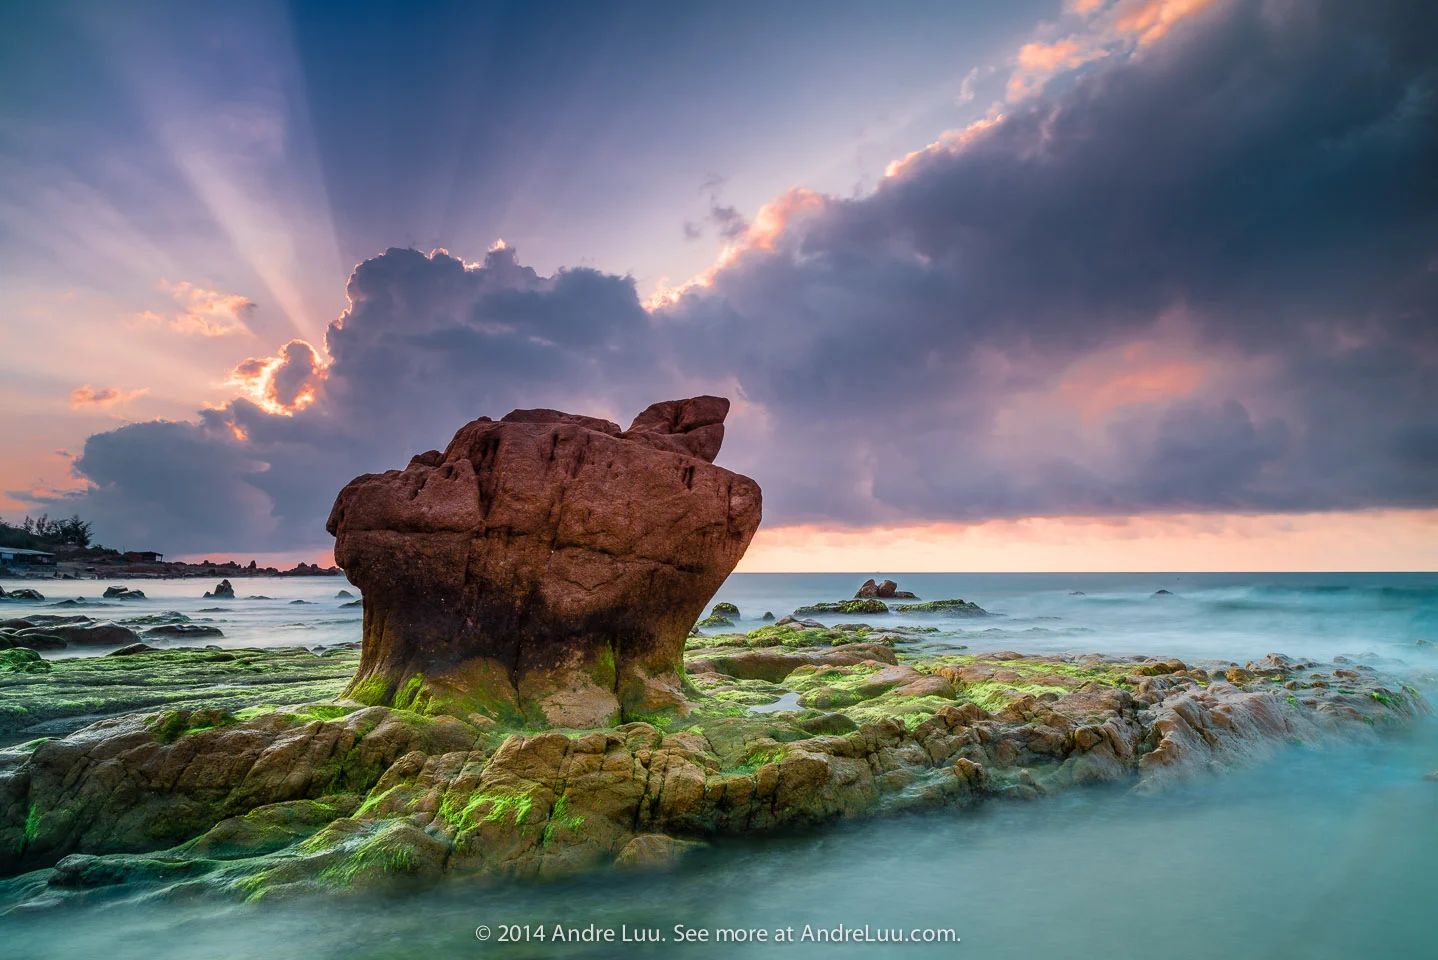
The image is optimized, so it captures detail in the brightest part, the sun, and in the darkest part, the plants and grass.
Benefits of optimal exposure?
As presented above, because your camera’s sensor has limits, you have to know how to use it as effectively and optimally as possible to fit the larger range of light signals in the scene into your smaller sensor. When you can do that, you will shoot images with the best quality your camera allows, and your images will gain several technical advantages, as follows:
- Rich and bright colors increase the initial attraction of the image.
- High contrast adds to the visual sense of sharpness.
- Clear and smooth because there is no noise
- High editing latitude with software, without affecting the quality of the original image.
- Shows even the subtlest details
The camera’s automatic metering is not optimal
The camera’s automatic metering cannot meet the high demands of optimal exposure as presented in this guide. These metering modes include Spot, Center-Weighted, Matrix… and all of them are automatic programs that try to meter “correctly”.
But because the lighting situation for each image and moment is so complex, especially when the frame has mostly dark details (night) or bright details (sand, snow, fog and mist), this automatic metering is off by a lot, sometimes by more than 2 stops. Whereas optimal exposure is accurate to within 1/3 stop of the sensor’s maximum capability.
However, you still have to use the camera’s automatic metering (e.g. switch to A mode to see what the shutter speed is) as a starting exposure, and only then use the histogram as the gauge to adjust the exposure until it reaches the optimal level you want.

The image with optimal exposure has the details of the clouds and rocks in 2 different bright and dark areas coming out fully and vividly.
Optimizing with camera settings
Unless you have special needs, set the options in your camera settings as follows to prepare your camera to save data to the file at the best quality possible. Go into the menu, find these 2 options and configure them as follows:
Image quality
Choose to save in RAW file format with the highest BIT depth possible. For example, a 14-Bit Raw file uses up to 16,384 tonal steps (tones) to express the brightness and darkness of an image, while a Jpeg file has only 256 tonal steps, 64 times fewer than raw. This means the transitions between bright and dark details in a 14-Bit Raw file will be much smoother and more natural than in a Jpeg file. Older-generation cameras have only 12 Bit, that is, 4,096 tonal steps.
Color space
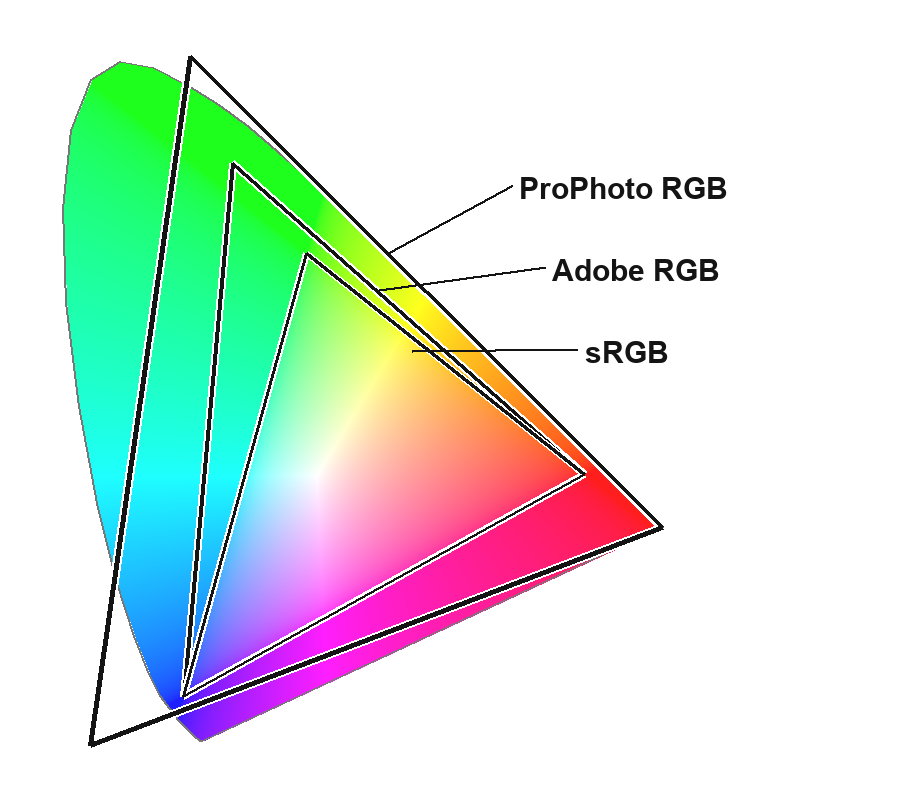
Like tones, colors are contained in a color space. For this option, choose Adobe RGB instead of the default sRGB because the Adobe RGB color range is wider than sRGB, so it lets you edit the image more while still keeping soft, natural color transitions.
In addition, in RAW processing software such as Photoshop and Lightroom, you have one more option, ProPhoto, a color space with an even wider color range than Adobe RGB. If you need to convert from a RAW file to another format such as Tiff for further processing, you should choose ProPhoto as the color space before exporting the file, to keep an even better color range.
Optimizing with the histogram
The histogram is a tonal chart that tells us what tonal steps the light details in the image you just shot have. The left edge of the chart represents the darkest tonal step, or pure black, and the right edge represents the brightest tonal step, or pure white. Below is the white luminance histogram, used to check the overall exposure, which is the main tool used in this guide, and the 3-color (RGB) histogram, used to check the exposure for each color, which you do not need to use.
Histogram of a correct exposure |
When the light in the scene is within the capture range of your camera’s sensor, meaning the scene does not have high contrast or its contrast has already been reduced with a Grad ND filter, the histogram of that scene will have the following characteristics: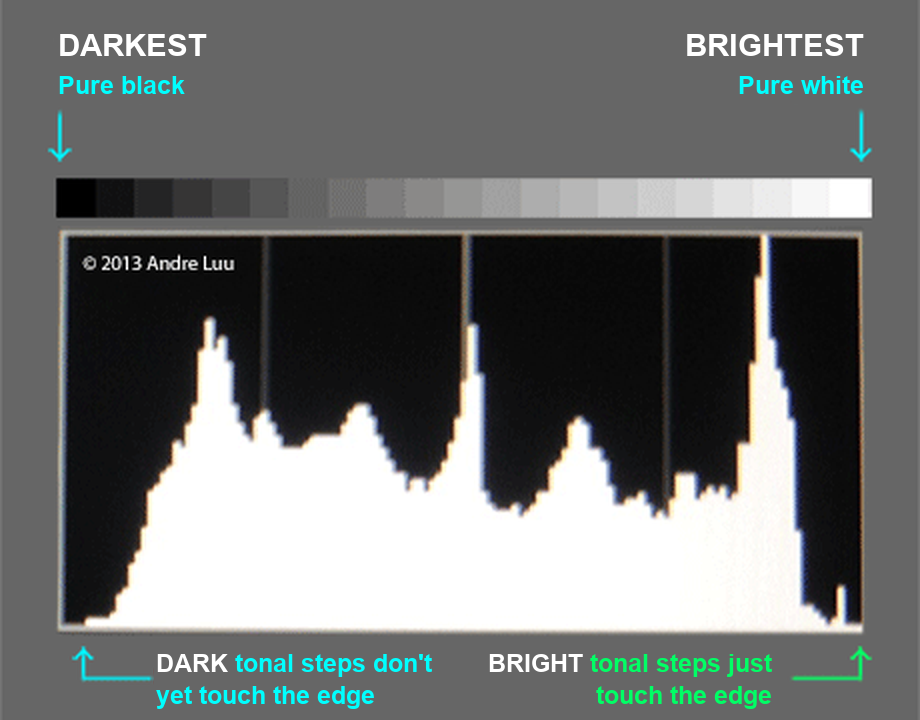
1. The brightest tonal step just touches the right edge at the bottom (does not climb up the right edge) 2. The darkest tonal step does not yet touch, or just touches, the left edge at the bottom (does not climb up the left edge) These two factors mean that all the tonal steps from darkest to brightest in the scene being shot have been fully recorded in the image, without being clipped to black or blown out to white. |
When the correct exposure is brighter than reality |
| In some cases where the scene has little contrast, such as clouds or fog, shooting so the histogram touches the right as above will make the image look too bright, and the camera may blink an overexposure warning.
Rest assured, because an image with correct exposure can be brighter than in reality, and you only need to darken it as you like when processing it in software.  The image above was darkened in Lightroom by -2.3 stops (reducing exposure) during processing. All the detail data is in the file; it just isn’t displayed by default, and we have to process it for it all to show. This is an important characteristic of digital photography that you should remember. |

Histogram of underexposure |
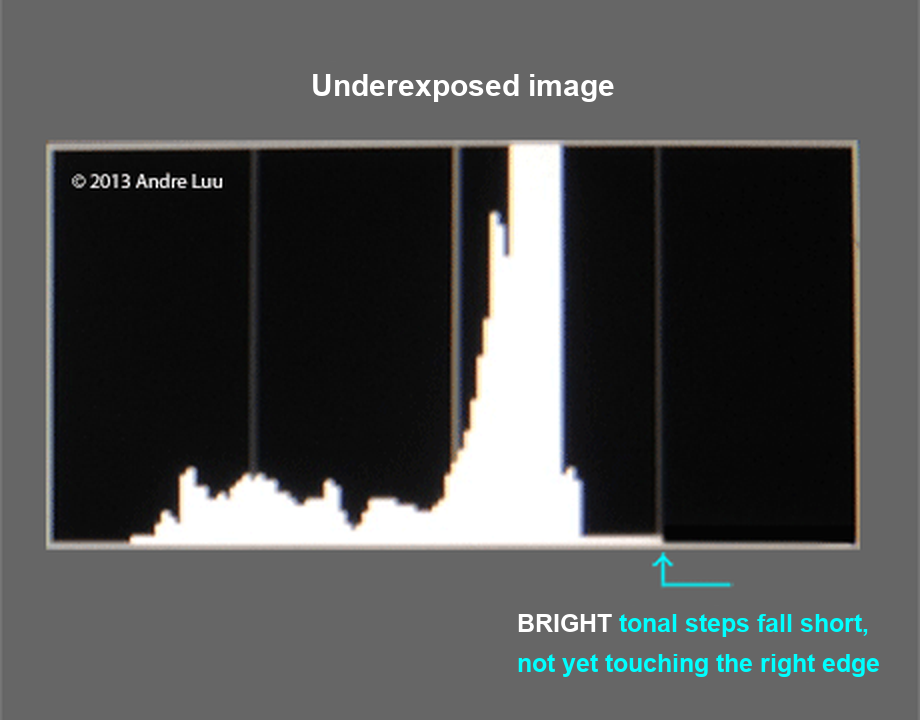 When an image is underexposed, the first tonal step on the right has not touched the right edge of the chart frame but is still a long way off; the farther away, the more the light is lacking. This shows that the light signals in the image have not yet covered everything your camera’s sensor can record. An underexposed image, when brightened in processing software, will get noise; the more you brighten it, the more the noise increases. |
Histogram of overexposure |
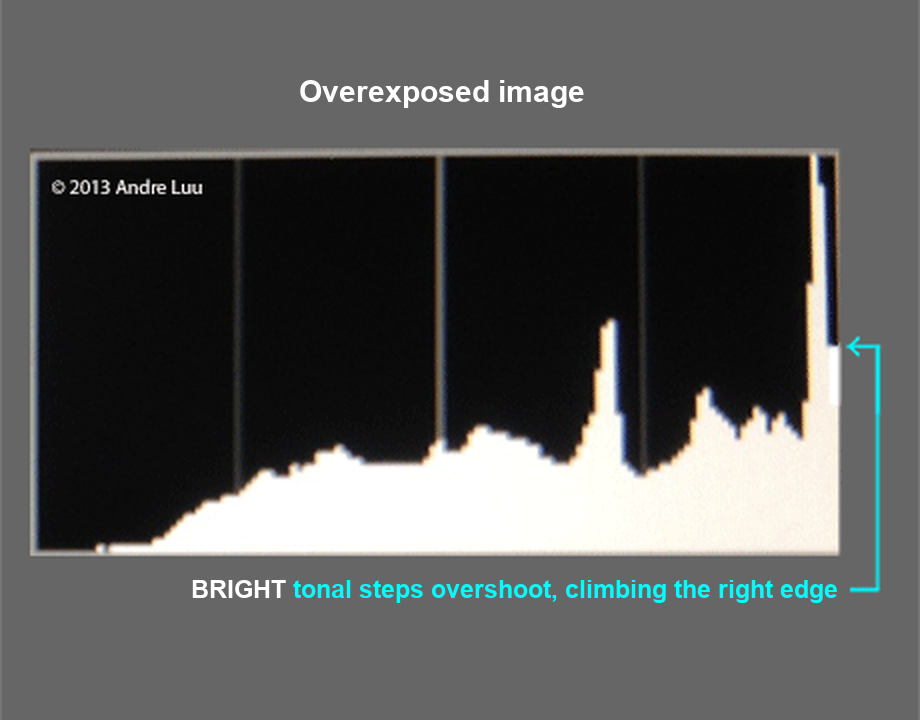 When an image is overexposed, the first tonal step on the right not only touches the right edge of the chart frame but also climbs up it. This shows that the light signals in the image have exceeded the brightness your camera’s sensor can record. The part that exceeds will be completely white without any detail. |
Histogram of an exposure beyond the sensor’s capability |
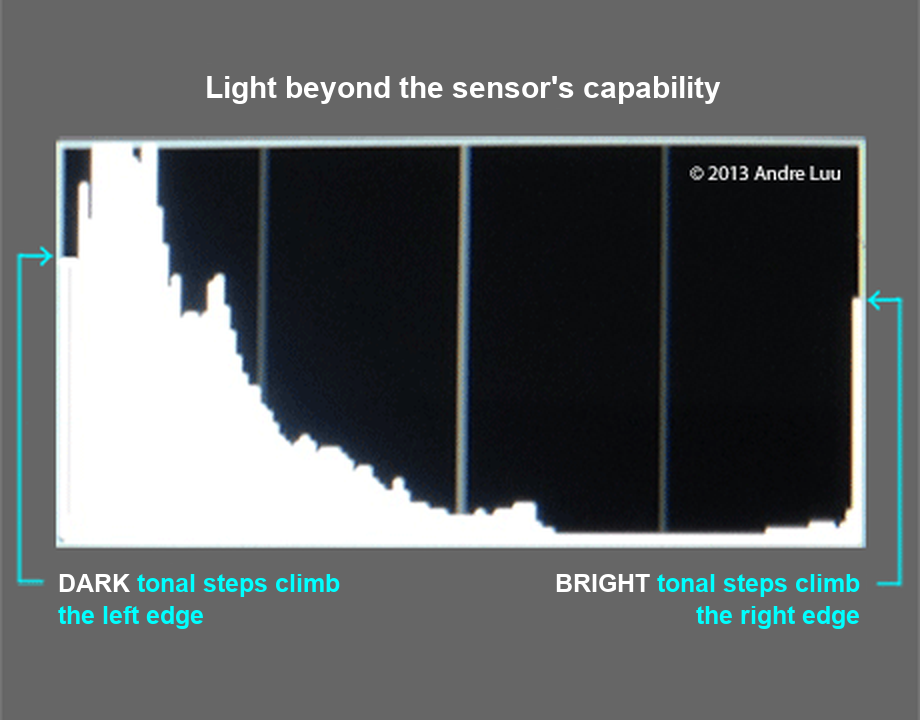 In real-world landscape photography, the sun and the glowing clouds are the focal point to build the composition around because they have stunning colors. When shooting straight toward the sun, the range of light in the scene almost always exceeds the capability of the sensor. In this case the histogram will climb the right edge (blown highlights) and at the same time climb the left edge (crushed shadows), and all the detail in those clipped areas is lost. The detail of the clipped areas is gone, leaving a white or black patch in the image that cannot be rescued in processing software. |
How to fix an exposure beyond the sensor’s capability
Often in practice, the most beautiful moments in landscapes almost always involve the sun, which means scenes with high contrast, or a range of light with more stops than the sensor can handle. To fix this problem, you can apply the following methods:
1. Prioritize the bright areas |
| If the details in the dark areas are not important, or you want to create a black silhouette style, then optimize for the bright areas by adjusting so the histogram just touches the right edge and letting the left side climb. Adjust the exposure mainly with the shutter speed, because you want to keep the aperture and ISO optimal or close to optimal, so use them last. The glowing clouds will be clear and beautiful, and the rocks in the foreground will be in black shadow.
For some scenes where the foreground has a beautiful and interesting shape even when it is just a single black color, this option is good. Apart from that kind of foreground, most other scenes will be dark and unattractive with this option. But if you don’t have a filter to reduce the light of the sky area, this is the best option, and when processing, brighten the shadows more and accept noise in the image to rebalance it. With a current sensor at base ISO, brightening the shadows by 3 stops gives roughly the noise of a shot taken at ISO 800. |

2. Prioritize the dark areas |
If the details in the bright areas are not important, then optimize for the dark areas by adjusting so the histogram just touches the left edge, and letting the right side climb. The glowing clouds will be blown out, but the rocks in the foreground will show all their detail clearly. This method very rarely solves the problem, because the sky is a main beautiful part of a landscape photo; it must not be blown out and lose all its color and detail. Image optimized for dark details. The dark tonal step just touches the left edge of the chart frame. |
3. Prioritize both bright and dark areas – balancing the light |
This is the method you want for most of your images, because the image has full detail from the bright areas to the dark areas. To achieve that, you have to reduce the bright areas so the range of light in the scene shrinks (balancing the light) and can fit within the capture capability of your camera’s sensor. Below are the different methods, ordered from the most effective. Image optimized for both bright and dark areas with a 2-Stop hard Grad ND filter to balance the light between the sky and the foreground. |
a. Balancing the light with a grad ND filter |
|||
| A Grad ND filter is a type of filter whose top half is dark and bottom half is light. The dark part has from 1–4 stops to hold back the bright part of the sky, reducing the scene’s range of light. Grad ND filters are divided into many types, because the transition edge from light to dark differs in hardness and in its position on the filter, to suit many different kinds of scenes. | |||
 |
Grad ND hard edge filterThe type with an abrupt transition from light to dark, used for scenes with a relatively clear dividing line (e.g. the horizon) between the bright and dark areas, like most seascapes with no foreground rising above the horizon. |
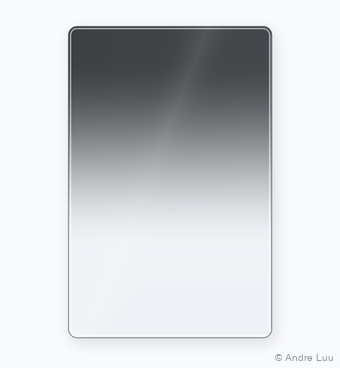 |
Grad ND soft edge filterThe type with a soft transition from light to dark, used for scenes where the dividing line between the bright and dark areas is broken and has no important details, like most mountain scenes where the horizon is a line of peaks rising and falling, high in places and low in others. |
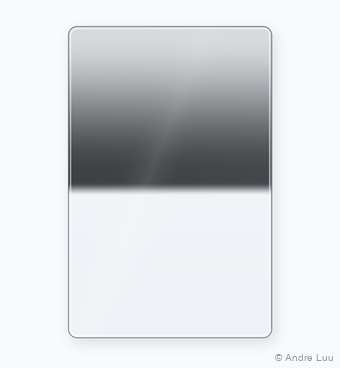 |
Grad ND reverse filterThe type with a hard transition from light to dark that then becomes gradually softer toward the top edge. This filter is used for scenes with a clear dividing line between the bright and dark areas (because it is hard) and with the sun present in the image (high contrast). Because the clouds above the sun gradually become less bright toward the top edge of the frame, the filter is also designed with a density that decreases gradually to keep the image natural. |
 |
Grad ND blender filterThe type with a transition from light to dark that is soft like the Grad ND Soft Edge, but the transition edge is near the bottom edge instead of in the middle of the filter like the Grad ND Soft Edge mentioned above. This filter is made specifically for scenes with water in the foreground, because water reflects at an angle to the viewer’s eye, so if you look closely you will see the water surface gets gradually darker near the bottom edge of the frame. This filter is designed to reduce the brightness of the sky and of the reflection on the water, and gets gradually lighter toward the bottom edge. |
For example, a sunrise scene before the sun appears or a sunset after the sun goes down has 17 stops (counting from the darkest ground to the brightest glowing clouds); with your camera capturing 14 stops, you need to reduce the sky by 3 stops. So you attach a 3-stop Grad ND filter to cover the sky and darken it. The sensor will capture all the signals of the scene, and all the details from the bright areas of the glowing clouds to the dark foreground will show clearly with full color and high contrast. Image with the bright areas reduced by a 2-Stop hard Grad ND filter to fit the sensor’s capture range |
|||
b. Exposure blending
For scenes with a clear transition line, like scenes where you could use a hard Grad ND filter, this technique can be processed very easily. You just need to shoot shot 1 optimized for the bright areas and shot 2 optimized for the dark areas, then use Photoshop to blend the 2 shots, masking out the 2 non-optimized parts to combine the 2 optimized parts.
For scenes with an unclear transition line, like scenes where you could use a soft Grad ND filter, processing the details in the transition area is extremely difficult and takes a great deal of time to make it natural without revealing the bright or dark parts of the 2 exposures being blended.
Because of the complexity of blending, as well as having to shoot multiple shots, which costs shooting time and the moment, you should only use this technique as a supplement to the Grad ND filter, for scenes where you cannot use a filter, because then the filter would turn important details in your image black. Please see the 2 illustrations for these 2 cases below:

The image has a grayish-white branch rising above the horizon, so using a filter would turn the top of the tree black; in this case 2 exposures had to be blended.

In this image the bright part is right in the middle of the image, and the top part of the cave mouth is an important detail, so the 2-exposure blending technique has to be used if the sky outside is too bright, beyond the sensor’s capture range.
c. HDR blending
The HDR blending technique uses an algorithm to balance many different light areas taken from a series of images with different exposures. Because many images are stacked together, images with movement will show different positions of what moved and create many errors in the image. So in scenes with moving details such as waves, drifting clouds, swaying branches and leaves… these will show up in the final image, and processing this part takes a lot more effort, while the final result is still not as natural as the filter or exposure blending methods.
In addition, it is hard to apply to long exposures in Bulb mode, because the time will increase many times over. However, this technique works well for scenes without movement, such as architectural interiors.

HDR image blended from 5 shots with exposures 2/3 stop apart, in Photomatix software using Tone Mapping mode. The wind made the top of the lift-net pole on the left sway and blur on both sides, so I had to use clone in Photoshop to remove it, which took a great deal of time.
To use the HDR technique, shoot a bracketed series of 3 or more shots, with the darkest to brightest shots covering the full range of brightness the image needs, and use software or the camera’s automatic HDR shooting mode to blend and process them.
The nature of HDR is that the more images you blend, with smaller exposure steps between them, the more natural the effect (e.g. blending 7 images 1/3 stop apart).
I myself have used this technique with Photomatix software, but in the end I no longer use it for the reasons above, and also because I have another option that is many times more effective: using a Grad ND filter. Moreover, many photo competitions do not accept images blended from multiple shots.
Histogram of optimal exposure
The reason I used the word “correct” for the histogram at the beginning of the guide is that, when the histogram touches the right edge, it may or may not already be optimal for your camera’s sensor.
The histogram you see on the camera when previewing the image you just shot is taken from the tonal data of a Jpeg file, regardless of whether you shoot Raw or Jpeg. This Jpeg file is created automatically by the camera for the preview function on the camera’s LCD screen after you shoot, so the in-camera settings related to Jpeg, such as Picture Control, will also affect this Histogram.
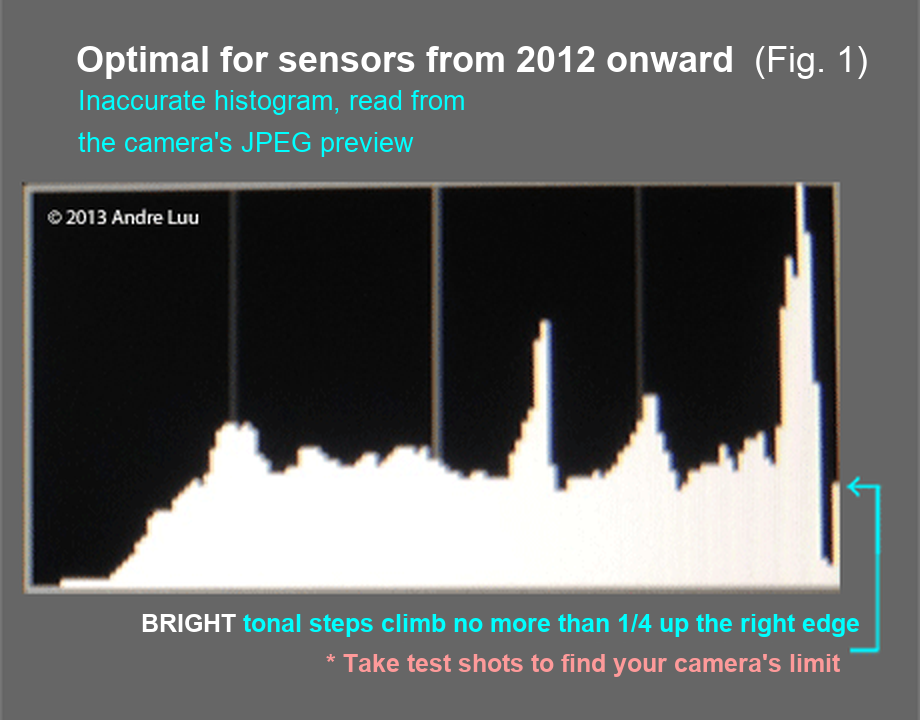
The histogram on the Nikon D800E, taking its data from the JPEG preview file, shows it climbing the right edge as in a blown-out case, but it is actually the optimal histogram for this camera’s sensor.
When you shoot Raw, you need Raw processing software before the file is exported to its final format. Raw software such as Photoshop and Lightroom also has a Histogram and reads the tonal data from that Raw file. Because the camera histogram and the software histogram read from 2 different source files for one image, that is why there is a difference between the camera histogram and the software histogram.
In camera generations before 2012, this difference was small, but in the new-generation cameras from 2012 onward, except the Sony A7/R (such as the Nikon D4, D800, D600, Canon 1DX, 5Dmk3, 6D…), this difference is relatively large. Today’s mirrorless cameras such as the Sony α7R VI and Sony α7 V also create the histogram from the processed preview image, not from the RAW data, so test your own camera the way described below.
In some of these new-generation cameras, when you shoot with the in-camera histogram just touching the right edge, the histogram in the Raw software is still a considerable distance away, which means your camera’s sensor has not yet been used to its full capability, and you can still increase the exposure until the software histogram just touches the right. For that to happen, the histogram on the camera has to climb the right edge as in the case of overexposure.
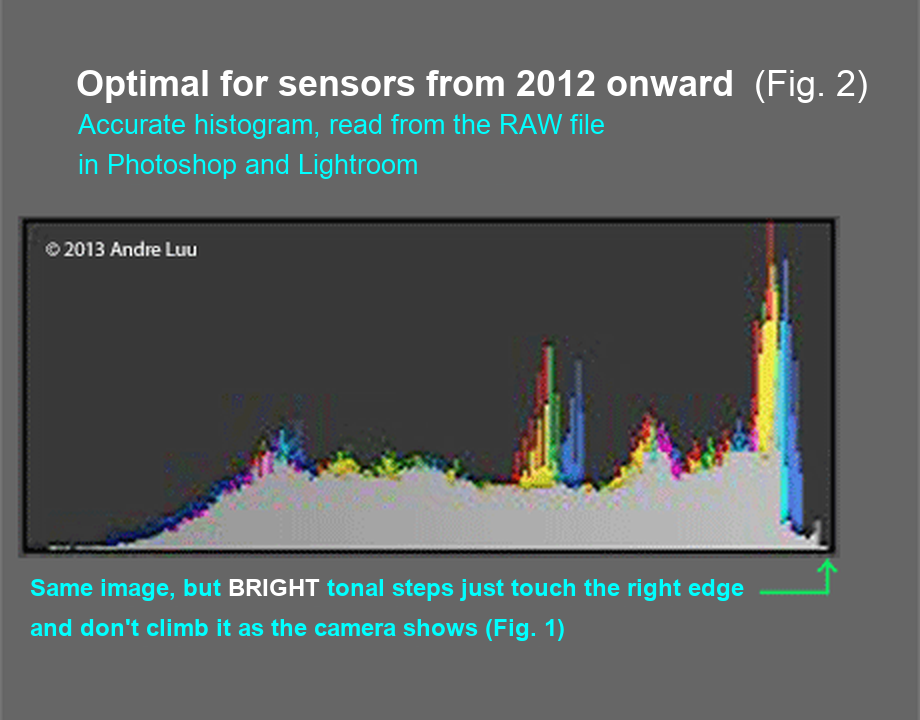
While the histogram of that same Raw file shows it as just right (optimal) in Lightroom (Nikon D800E)
The two histograms above were tested with a Nikon D800E, and it was found that the in-camera histogram climbing up the right edge by about ¼ of the chart’s height is equivalent to the histogram in the Raw software just touching the right edge (optimal). So if you shoot with the D800E above, you should adjust the exposure so that the chart climbs the right edge as in the image above; only then is it optimal while still not blown out.
Find the optimal point of your camera’s sensor
To know exactly what latitude your camera has, follow these steps:
- Shoot a first image with the in-camera histogram just touching the right edge as the baseline.
- Then shoot a series of 6 more images, adding 1/3 stop for each image. For example, with image 1 as the original, we have:
Image 2 = +1/3, image 3 = +2/3, image 4 = +1 stop, image 5 = +1 1/3, image 6 = +1 2/3, image 7 = 2 stops. - Then go into the Raw software (Photoshop or Lightroom), see which image just touches the right edge of the histogram in the software, note down which image it is (number and how many stops +), then put the memory card back in the camera and look at the histogram for that image.
For example, if the +1 2/3 stop photo is optimal, that is, photo number 6, when you view the histogram for photo #6, you note how many mm high its histogram climbs up the right edge, and from then on you shoot with the histogram climbing to exactly that height and you will have the optimal exposure for your camera’s sensor.

Image with optimal exposure, balanced with a 3-Stop Grad ND blender.
This article is for general education and is provided "as is". Photography outdoors carries risk: you are responsible for your own safety, gear and decisions. Disclaimer
Fine art prints
Signed, made to order on archival fine art paper, with the facts behind every photograph.
See the prints
Photo trips with Andre
Small groups to Lofoten, Iceland and Vietnam, at the right season and the right hour.
Ask about the next trips